
What is the limit to the amount of energy we can produce? Is EROI the best metric for future constraints? Let’s see!
In this article, I provide a simple algorithm to evaluate if a strategy is credible for an energy transition.
This article is part of a series on the DEC Report. The DEC report is a 200+ pages freely accessible report I wrote on climate change and energy. It assesses the world’s potential to tackle climate change by removing GHG emissions in energy and agriculture, and it assesses how we can optimize this transition.
- ➡️➡️ The DEC Report (pdf)
- 🌊 Hydropower potential (1/8)
- ☀️ Solar potential (2/8)
- 🌬️ Wind potential (3/8)
- 🏭 Nuclear potential (4/8)
- 🛢 How much fossil fuel do we consume each year? (5/8)
- 🔥 Energy, EROI and limits to growth (6/8)
- ☢️ How many people died because of the Chernobyl disaster? (7/8)
- ⚡ Why do we close nuclear reactors? (8/8)
How and why is energy used?
This part is a practical simplification on how energy is used. Energy is mostly used to move objects. These objects can be particles, molecules or larger objects:
- Energy can be used to move air molecules, it produces heat, which is a form of energy.
- Energy can be used to move electrons in cables, it produces electricity, which is another form of energy.
- Energy can be used to burn oil, to turn the wheels of a vehicle, it produces a movement which gives kinetic energy to the vehicle.
Example: In the motor of a vehicle, a part of the heat is converted into a movement. Approximately 1/3 of the heat creates the movement, 2/3 of the energy used result in waste heat. During winter, this ”wasted” heat can be used inside the vehicle, which means that it is no longer considered waste heat.
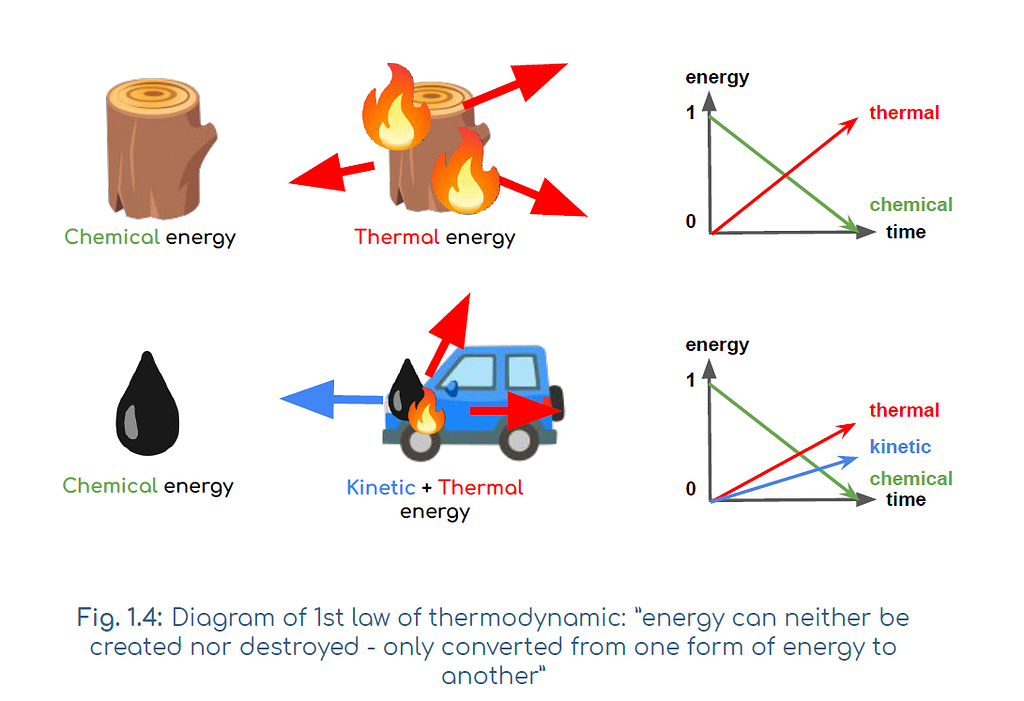
From a physical point of view, energy is never lost, it is just transformed. From a practical point of view, energy as dissipated heat, ”waste heat”, is hard to use. It is considered as ”lost”, but the energy still exists.
Energy is mainly used to improve living conditions, including: moving food, heating up or cooling homes and food, building homes, workplaces, and transporting or transforming objects to meet society’s needs.
Energy Return On Energy Invested (EROI/EROEI)
EROI, or EROEI, is the Energy Return On Investment / On Energy Invested. In order to extract energy from the environment and to later use it, it is required to use energy.
Hopefully, more energy is extracted from the environment than how much was used to extract it from the environment.
Example: If 1 kWh of oil is used to extract 10 kWh of oil, the EROI is 1:10, or 10.
As suggested earlier, these considerations on energy depend on the point of view:
- If 1 kWh of oil is required to extract 10 kWh of oil, the EROI is 10.
- In another situation, 1 kWh is required from external sources, and 20 kWh of oil are required from the exploited reserve, to extract 10 kWh of oil. 10 new kWh of oil are available thanks to 1 kWh of external energy. Energy is produced, according to how energy production is accounted for. But the EROI of such operation including the 20 kWh which came from the reserve is under 1.
Multiple conventions were defined on how to compute EROI to try to account for what researchers consider useful for their work.
Because technologies change, and, because conventions may vary between multiple researchers, EROI figures per energy source vary. Standards and research are constantly evolving on these topics for all energy sources.
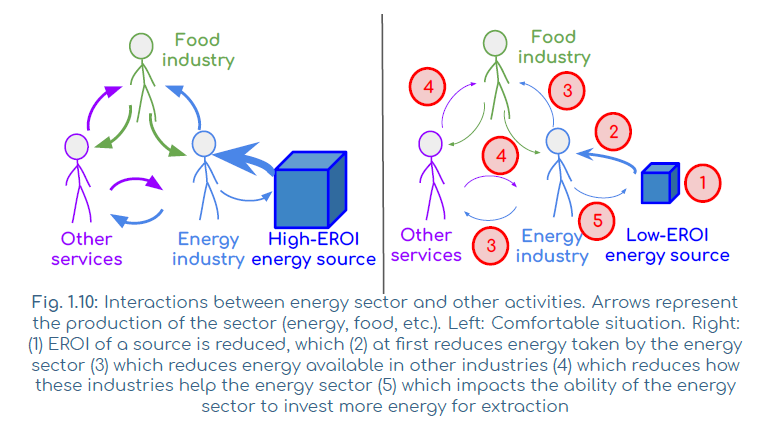
When EROI is used in research, it can be implied that there is a required EROI to keep good living conditions. It is considered that society developed during and after the industrial era because of energy sources with a high EROI. This readily available energy allowed people to move more objects, including building homes, industries, roads, vehicles, etc. It is thus considered that, with low EROI sources, maintaining current living conditions would be more difficult. One evaluation of the ”break-even EROI” to maintain economy is 1:7.
Energy contributes to other sectors (agriculture, industries etc.). If the EROI of an energy source is reduced, it’ll impact the energy sector. This impact will be passed on to other sectors of the economy. And, because the energy sector also depends on these other sectors, it’ll re-affect the energy sector and its ability to keep producing as much energy.
Assessing the limits
So, do we just need an EROI > 1 to maintain our society? No, because not 100% of the energy we produce is used to re-produce more energy. With an EROI of 1, we need to use 100% of the energy to be used by the energy sector to keep producing as much energy. With an EROI of 1/2, we would need 50%.
But, how much energy do we actually use to maintain the energy sector? Well this number is hard to find and to assess because the energy sector also uses all other industries to maintain itself.
However, we can build an algorithm to estimate if an EROI is high enough to maintain the energy production of a society. The rule is quite simple, if EROI > 1/p, with “p” the proportion of total energy used to re-produce more energy, then growth can be maintained. Otherwise, we either need to find a source of energy with a higher EROI, or, we need to dedicate more energy to re-produce more energy (and less for other activities).
We can use this algorithm in a scenario to estimate if replacing fossil fuels is realistic, for example in an electrification strategy.
Results
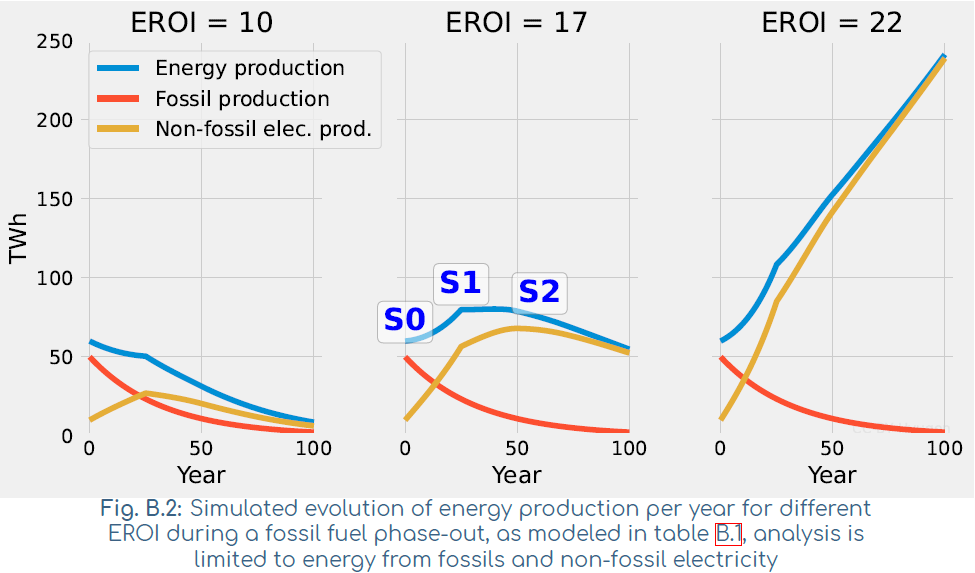
In the results I annotate 3 states. Even with a low EROI, a society can at first raise its energy production, this is state S0. However, because this society is simultaneously removing fossil fuels and because other constraints apply (low lifespan of some energy system, etc.), energy production can reach a peak. This is state S1. After this peak, the energy production continously decreases because of a too low EROI, this is state S2. This is just one possible and simplified situation. If the EROI is high enough the energy production will continuously increase for a long time… if this EROI can be high enough for a long time.
For these results I consider p=5%, 5% of the energy we produce is dedicated to re-produce more energy.
Numbers used should be considered as a simplified representation of reality.
- For ”very low” EROI solutions (=10), non-fossil electricity production grows at first, but energy production is never maintained.
- For ”very high” EROI solutions (=22 in the simplified model), energy production increases continuously.
- For ”low” EROI solutions (=17), an increase in energy production can be observed, before being followed by an infinite decline.
How fast the decline occurs depends on the configuration. EROI=17 is a risky position in which countries don’t realize at first they’re engaging in an unstable situation. Even in the EROI=10 situation, low-carbon electricity production can raise at first thanks to the consumption of fossil energy which is used to produce low-carbon electricity. EROI=22 would be the most comfortable situation, but it means we need efficient-enough low-carbon energy production systems.
Algorithm
You can try this algorithm in Python to re-obtain the same results or try other parameters.
#init
fossil_systems, elec_systems = [50], [10] #Energy unit (TWh for example)
Sy = [fossil_systems[0]+elec_systems[0]]
prop_nrj_for_new_nrj = 0.05 #proportion of energy available to increase energy prod
elec_lifespan = 25#years
fossil_reducpyear = 3#percent
eroi_of_loweroi = 17 #EROI of the "low" EROI solution
max_y = 100 #Number of years to compute
year_range = range(1, max_y+1)

#compute eol for already installed production (presupposed same lifespan)
delta_elec = [0]*(len(year_range)+elec_lifespan+1)
for y in range(1, elec_lifespan+1):
    delta_elec[y] = -elec_systems[0] / elec_lifespan

#production future years
for y in year_range:
    #amount of energy available for energy transition
    energy_for_elec = Sy[-1] * prop_nrj_for_new_nrj

    #compute how much energy will be added during the next years
    added = energy_for_elec * eroi_of_loweroi / elec_lifespan
    delta_elec[y] += added
    delta_elec[y+elec_lifespan] -= added

    #compute next states
    elec_systems += [elec_systems[-1]+delta_elec[y]]
    fossil_systems += [fossil_systems[-1] * (1-fossil_reducpyear/100)]
    Sy += [fossil_systems[-1]+elec_systems[-1]]
Links
You can see how some of these results were used in much more details in the DEC report. Some of the data and models I used are also available on Github.
👏 if you liked this article and I’ll do more!